Advanced electoral intelligence
Producing a reading of the balance of power that is as precise as possible — and as honest as necessary about its margins of uncertainty.
Who it is for
Candidates, parties, institutions and organisations seeking a detailed understanding of an electoral environment.
When
Throughout the electoral cycle: upstream to inform strategy, during the campaign to track dynamics.
Key deliverables
Electoral atlas, modelling notes with intervals, seat allocation simulations.
Understanding mechanisms rather than commenting on trends
Public debate consumes electoral figures without always questioning how they are produced: a single poll is discussed as if it were the truth, a national average hides opposite territorial realities, a share of the vote is confused with a distribution of seats.
Electoral intelligence draws on electoral sociology — from the founding work on social cleavages to contemporary analysis of turnout — and on applied statistics. It helps distinguish what stems from the deep dispositions of the electorate, from the short-term context and from the institutional effects of the electoral system.
Our standard is twofold: to produce the finest analysis the available data allows, and to report its degree of uncertainty systematically. An honest interval is more useful for decision-making than a misleading single figure.
What the engagement covers
Four complementary fields of analysis, used according to the question at hand.
Prudent electoral modelling
Aggregation of polls weighted by methodological quality, reported as confidence intervals.
Analysis of socio-political cleavages
Rural/urban, generational, regional and social divides that shape preferences, studied at aggregate level.
Differential turnout
Mapping turnout gaps between areas and groups, and analysing what drives them.
Electoral system analysis
Mechanical and psychological effects of the voting system and boundaries on converting votes into seats.
Electoral geography
Spatial reading of results and identification of territorial continuities and breaks.
Opinion tracking
Dashboards showing how voting intentions and perceptions evolve over the campaign.
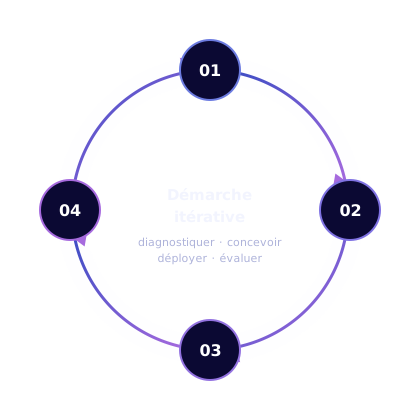
From raw data to useful analysis
A rigorous process, documented at every stage to ensure results are traceable.
Collection
Gathering official results, demographic data and available surveys.
Quality control
Consistency checks, harmonisation of boundaries and assessment of sources.
Modelling
Applying suitable models, making assumptions explicit and calculating uncertainty.
Reporting
Maps, notes and tables designed for decision-making, with a reading of their limits.
Explicit, verifiable methods
Every tool we use is documented: its sources, assumptions and limitations are known to our clients.
Weighted poll aggregation
Combining several surveys according to size, recency and methodological quality.
Ecological analysis
Relating results by area to their socio-demographic characteristics, while accounting for the limits of inference.
Seat allocation simulation
Applying the rules of the electoral system to different result scenarios.
Statistical mapping
Spatial representation of results and deviations from the average.
Sensitivity analysis
Measuring how conclusions change when assumptions change.
Measuring honestly
Every indicator is labelled by status — target, calculated estimate or measured result — in line with our principles of rigour
| Indicator | What it shows | Status |
|---|---|---|
| Aggregated voting intentions | The plausible range of the balance of power at a given date. | Calculated estimate |
| Expected turnout | The likely level of turnout by area. | Calculated estimate |
| Historical results | Official, sourced results of previous elections. | Measured result |
| Projected seats | Translating a vote scenario into seats under the electoral system. | Calculated estimate |
Analysis to understand, not to influence
Producing electoral figures carries a particular responsibility towards public debate.
Explicit uncertainty
No estimate is presented without its method, sources and margin of uncertainty.
No manipulative publication
We do not publish projections intended to sway opinion or discourage turnout.
Compliance with polling rules
We observe national provisions governing the conduct and publication of surveys.
Aggregate analysis
Cleavages are studied at the level of areas and groups, never through profiling of individuals.
An honest interval is worth more than a precise but wrong figure.AXIOME working principle
In what contexts do we work?
Illustrative situations: they do not describe actual engagements.
A proportional election
A party wants to understand how its potential scores would translate into seats across constituencies.
Falling turnout
Political actors want to understand where and why abstention is rising.
Conflicting polls
Surveys with diverging results call for an aggregated and critical reading.
Frequently asked questions
Depending on the engagement, we design surveys carried out by partner institutes or work with existing data. In every case, the methodology is documented and assessed.
Because every estimate carries uncertainty. A single figure creates an illusion of precision that leads to poor decisions.
We say so clearly, widen the margins of uncertainty and complement quantitative analysis with qualitative field research.
Related expertise
Let's discuss your project
Every political context is unique. A first, strictly confidential conversation allows us to understand what is at stake and define the most relevant support.